I Built a Quant Trading Platform. On a Weekend.
How I used Claude Code, open data sources, and a local FinGPT model to build a platform that ingests the same data Wall Street uses — and trades on it.
I learned options trading during the pandemic. Like a lot of people stuck at home in 2020, I started running strategies...the wheel, covered calls, cash-secured puts. I got decent at it. The problem was time. Day trading eats your entire day. Watching charts, managing positions, tracking earnings dates, adjusting strikes. I had a full-time job and a coaching business. The returns were real but the hours weren't sustainable.
What I wanted was the logic without the labor. A system that watches the same data I was watching...insider trades, analyst revisions, options flow, macro indicators...and makes the same decisions I would, but without me staring at a screen all day.
So I built one.
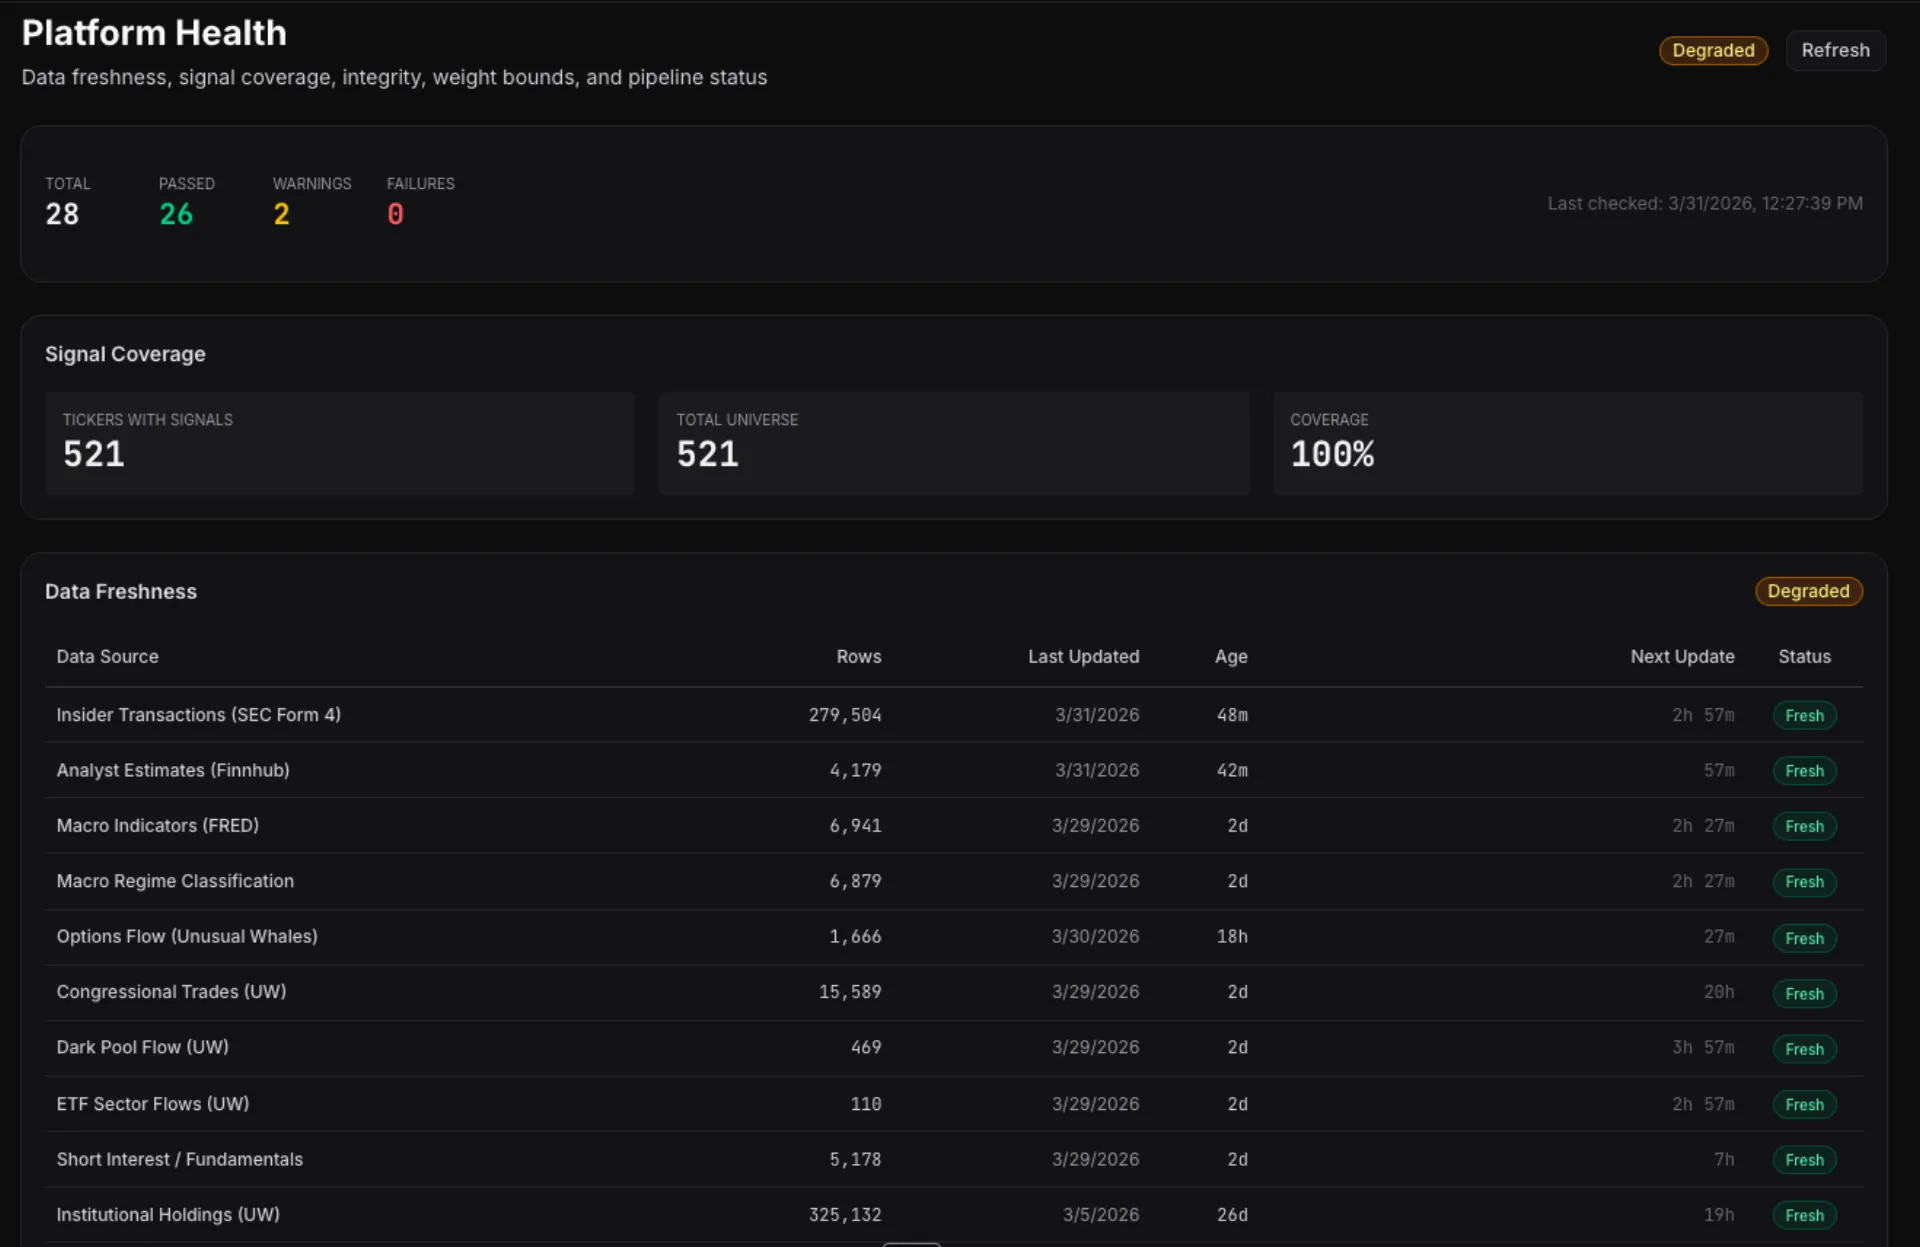
It took a weekend to get the first version running. Five weeks later, it has 14 active signal generators, an autonomous research pipeline, and a paper trading account that executes orders based on what the signals say. No Bloomberg terminal. No quant team. Just Claude Code, open data, and a Mac Studio running a local language model for news sentiment scoring.

The Data Sources
Wall Street's edge isn't secret algorithms. It's data access and speed. But most of the data they use is public — you just have to know where to look.
- SEC EDGAR — Form 4 insider transactions, 8-K material events, 13-F institutional holdings. Congressional members' stock trades via Senate EFD and House Clerk disclosures.
- FRED — Federal Reserve economic data. Credit spreads, Treasury yields, VIX, fed funds rate. The macro signals that move everything.
- Finnhub — Analyst estimate revisions, earnings surprises, company fundamentals, and now...company news headlines.
- Unusual Whales — Options flow, dark pool activity, short interest, ETF sector flows. The data that shows what institutional money is actually doing.
- FINRA — Historical short volume data going back to 2012. 1.67 million rows.
- Alpaca — Paper trading API. The broker connection that turns signals into orders.
All of it free or low-cost. The most expensive line item is the Unusual Whales subscription. Everything else is public APIs with free tiers.
14 Signals, One Composite Score
Each data source feeds into a standardized signal generator. Every signal outputs the same thing: a direction (-1 to +1, bearish to bullish), a conviction (0 to 1), and a decay rate (how fast the signal loses predictive power).
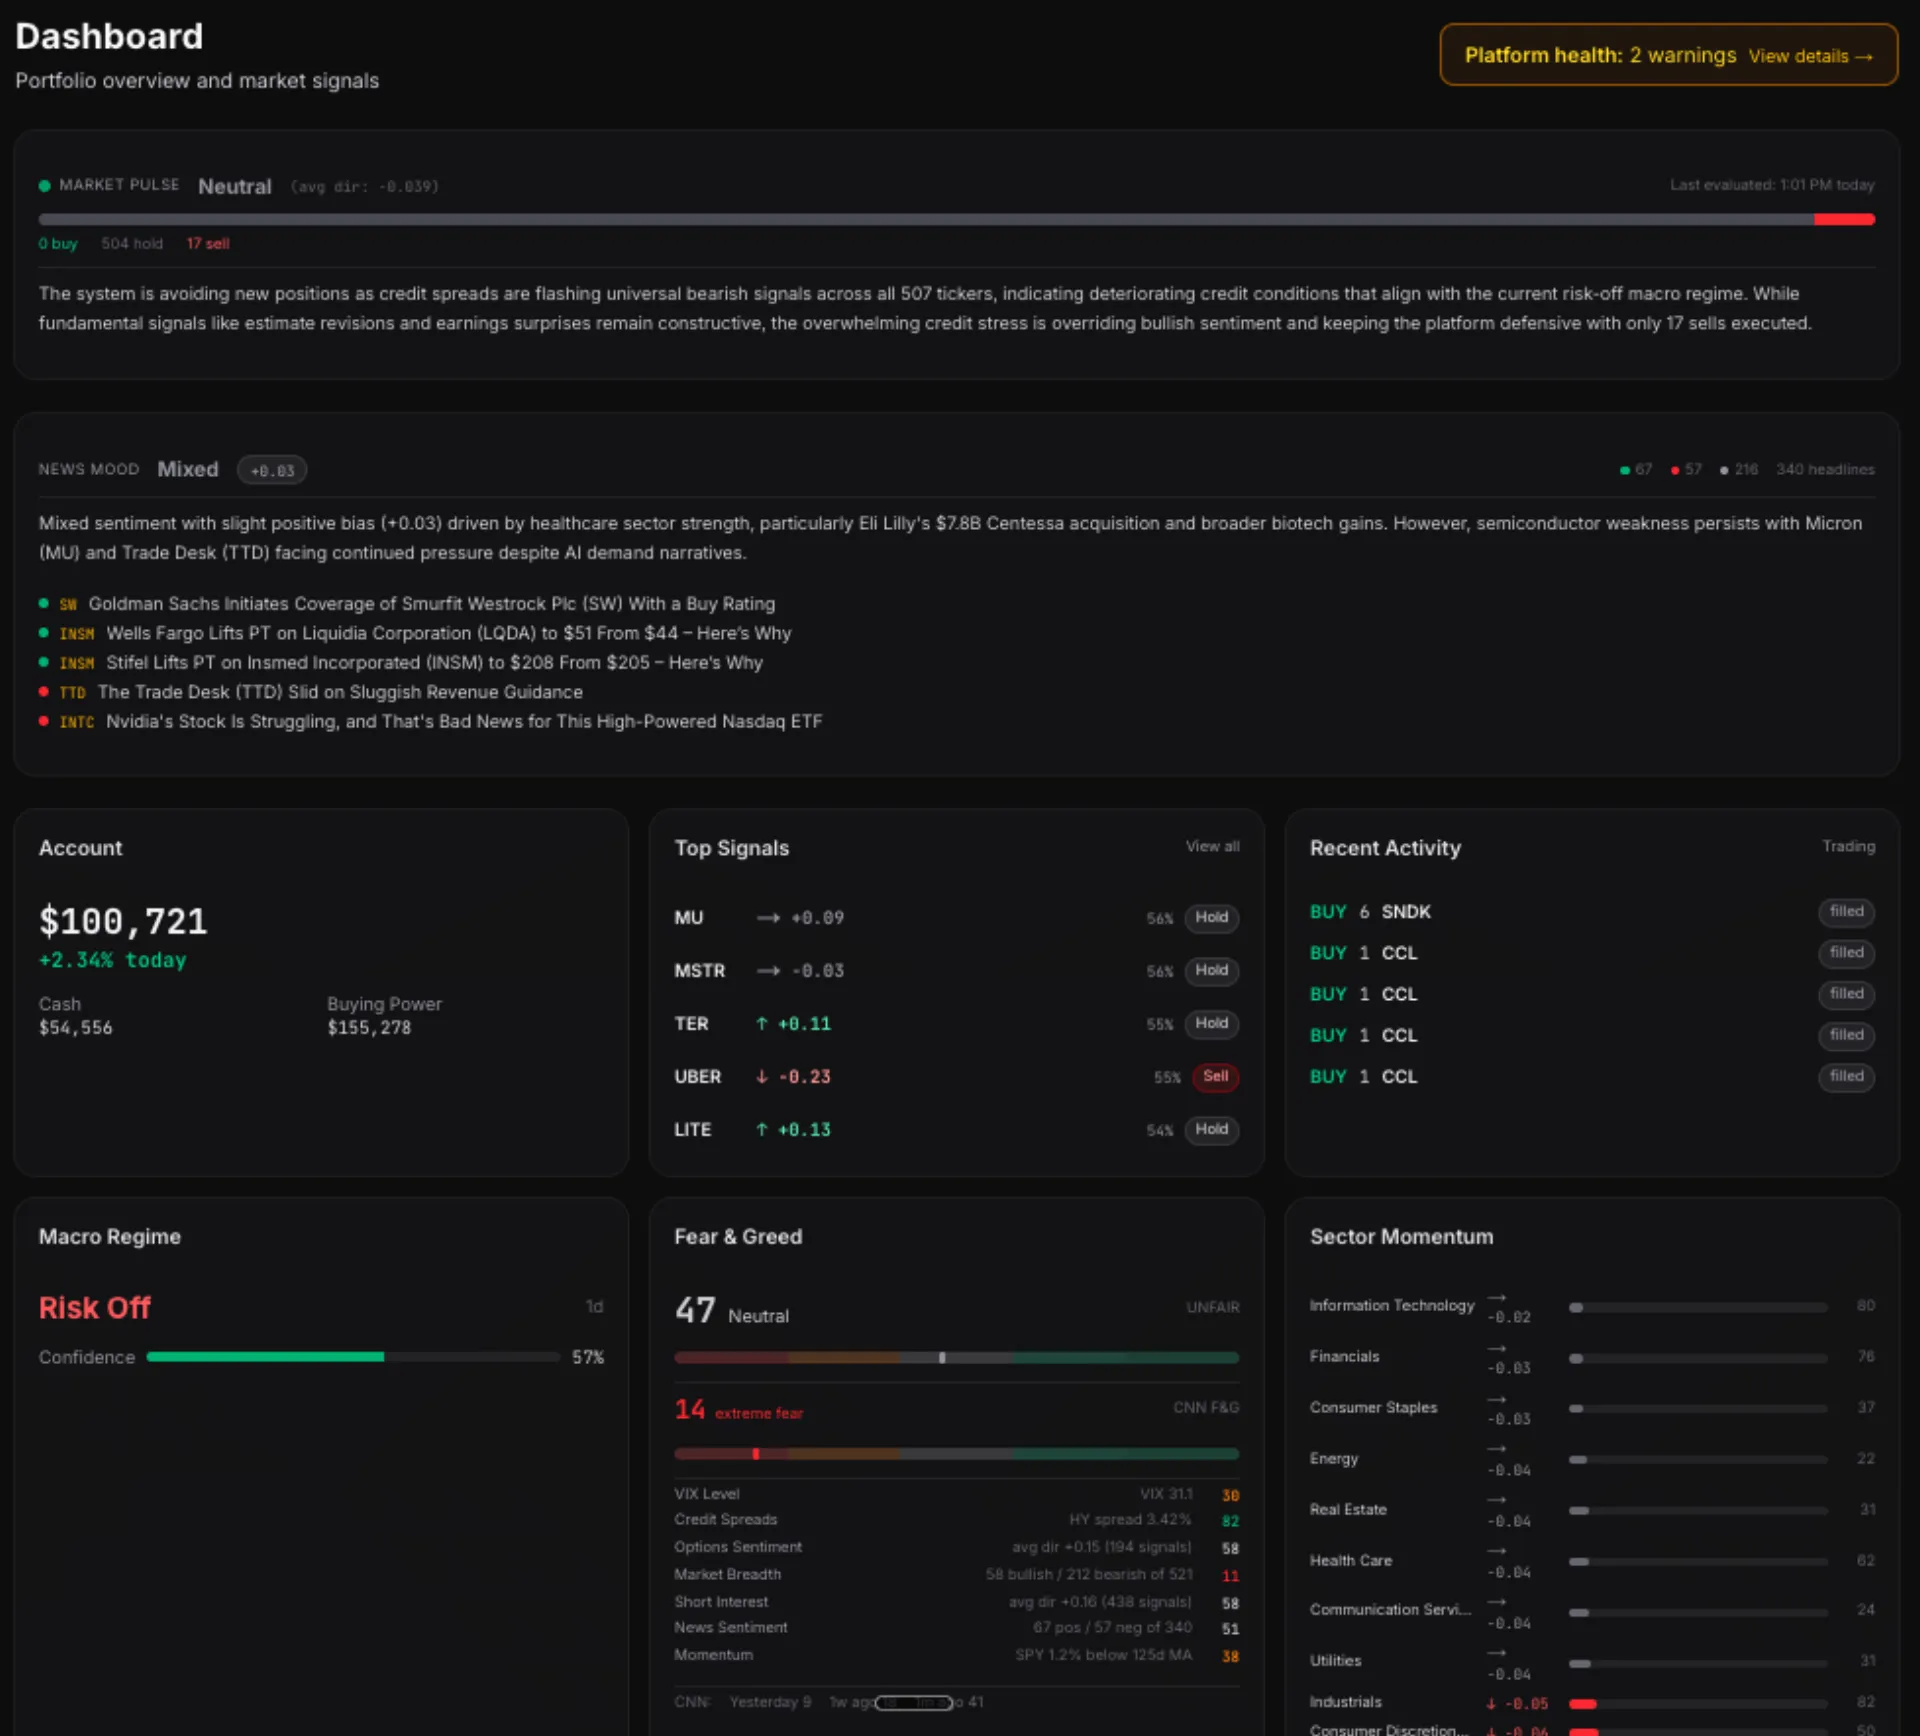
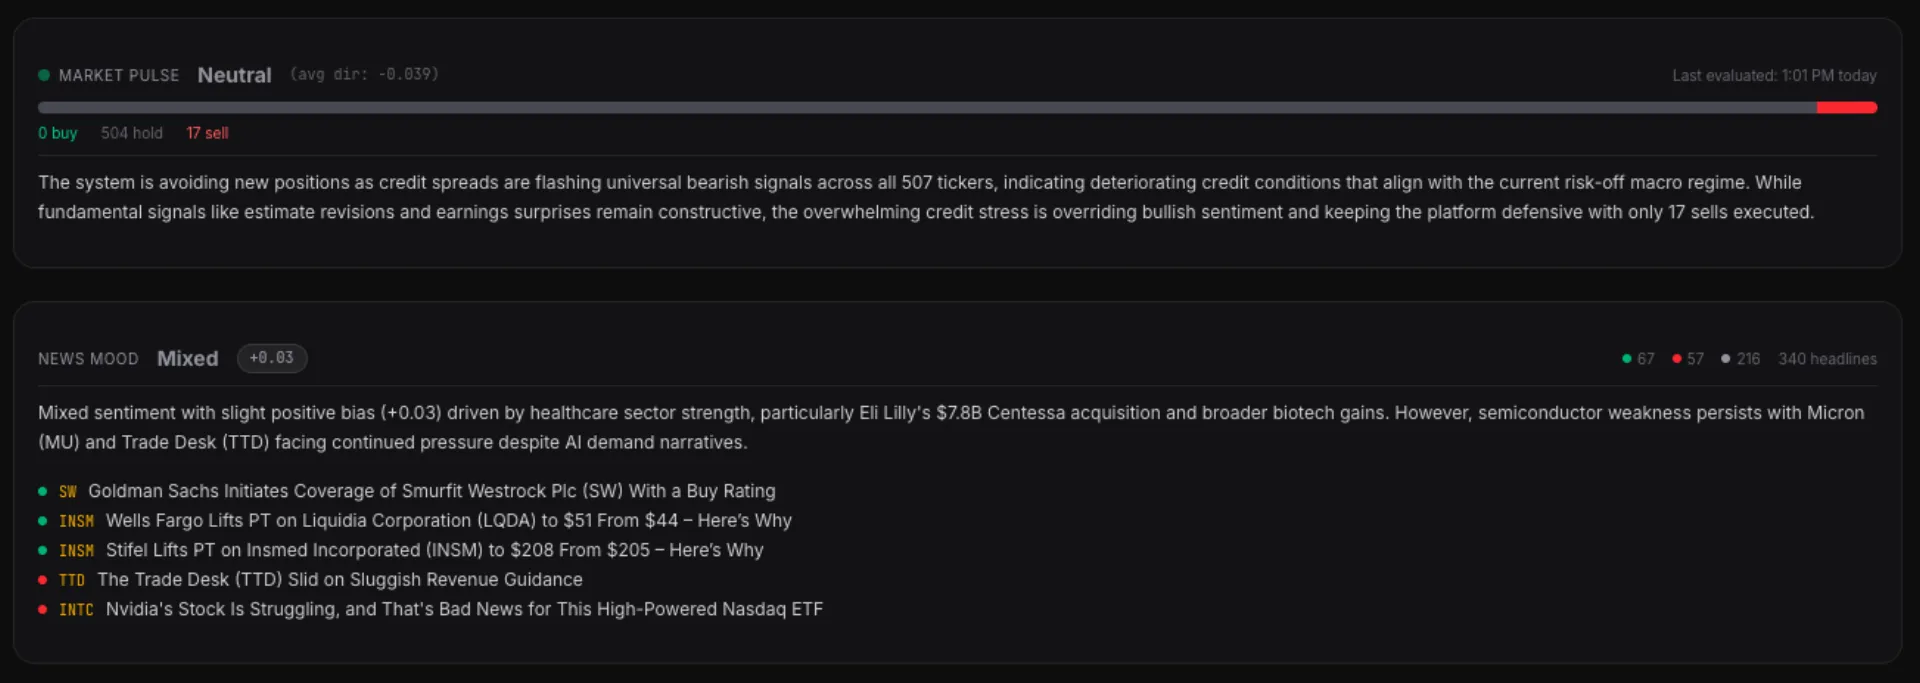
The combiner takes all active signals for a ticker, applies constrained adaptive weights, and produces a composite score. Above a threshold...buy. Below...sell. In between...hold. Right now, with VIX at 31 and CNN's Fear & Greed at 13 (extreme fear), 96.7% of tickers are in the hold zone. The system is correctly cautious.
Position sizing uses Half-Kelly criterion with hard risk limits — 8% max per position, 25% max per sector, 15% drawdown circuit breaker. A momentum dampener scales positions based on where SPY sits relative to its 125-day moving average. Below the MA...smaller positions. Above...full size.
FinGPT on a Mac Studio
The newest layer is news sentiment. Finnhub's company news API delivers headlines for the top 50 tickers by signal conviction. Those headlines get scored by FinGPT — an open-source financial sentiment model — running locally on my Mac Studio via Ollama.
No API calls to OpenAI. No per-token costs. No data leaving my network. The model classifies each headline as positive, negative, or neutral...and the results feed into both a per-ticker sentiment panel and a market-wide "News Mood" card on the dashboard.
The News Mood card also generates a one-sentence LLM narrative via Claude Sonnet — synthesizing the top headlines into something like: "Tech sector faces significant pressure with AAPL leading declines amid comparisons to the dotcom bubble burst."
That narrative sits alongside our quantitative Market Pulse, which aggregates signal direction across 521 tickers. Quantitative meets qualitative, on the same screen.
Our Fear & Greed vs. CNN's
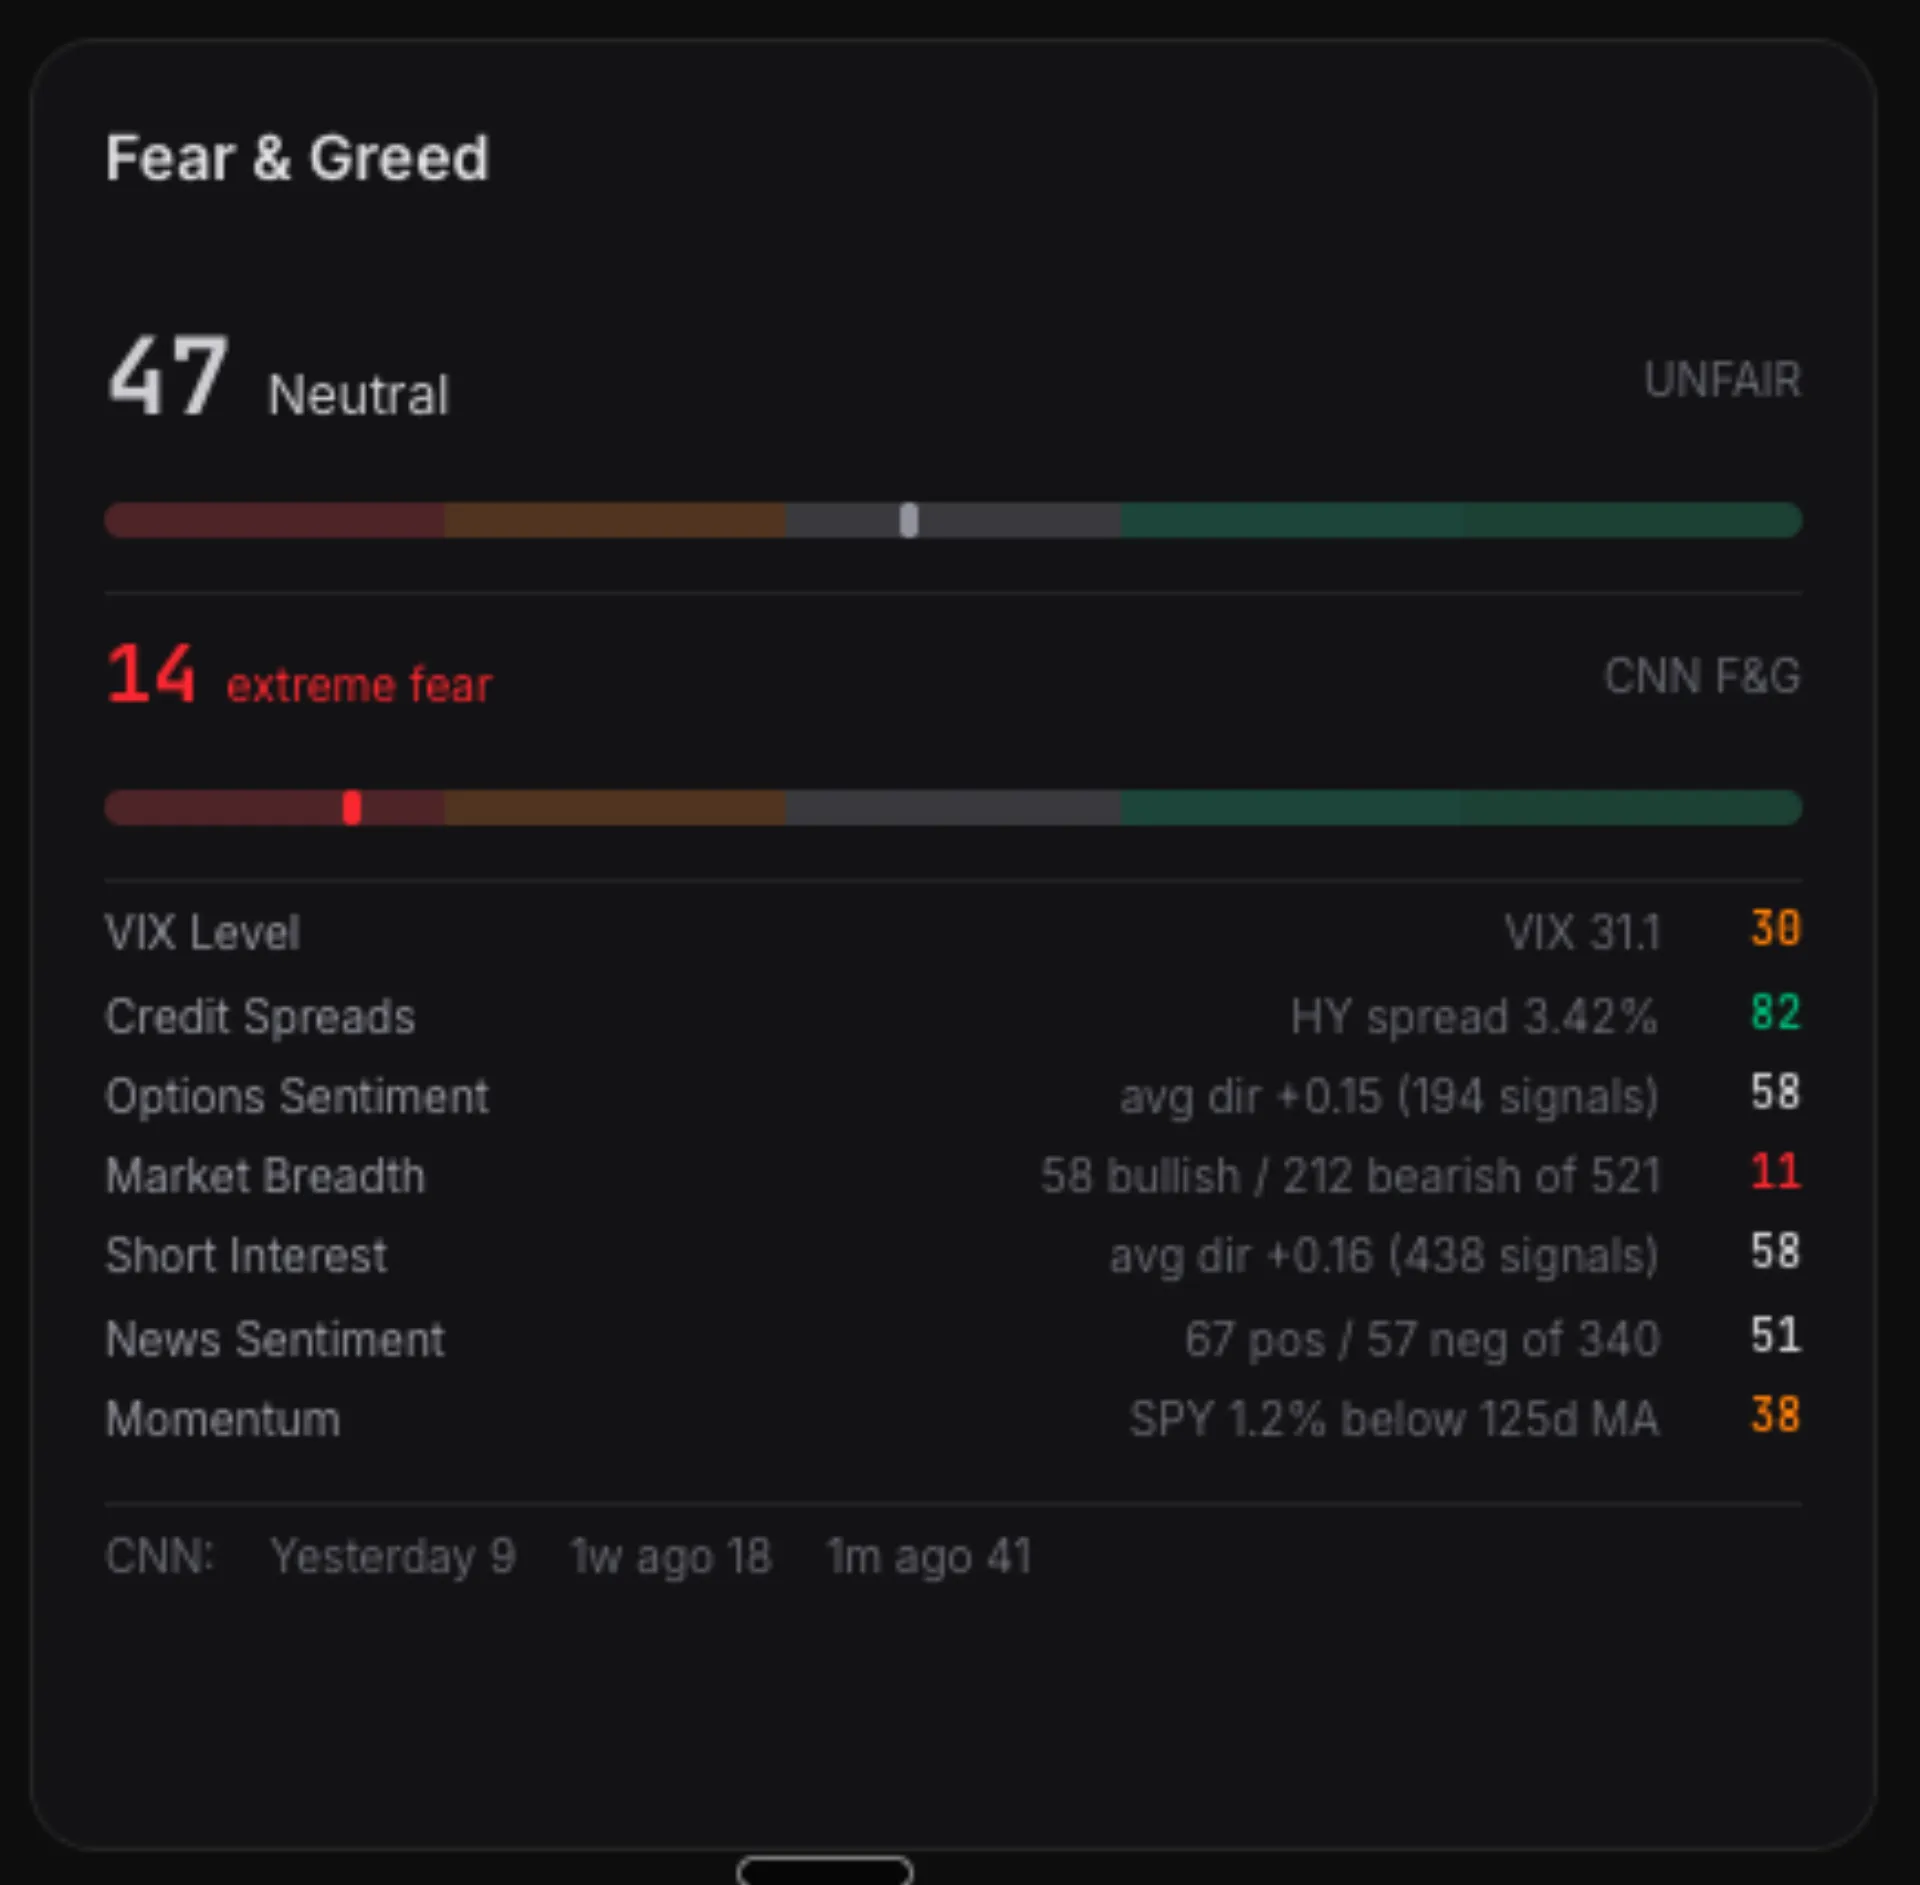
The Fear & Greed gauge I built uses seven components: VIX level, credit spreads, options sentiment, market breadth, short interest trends, news sentiment, and SPY momentum. Each normalized to 0-100. The dashboard shows both our score and CNN's side-by-side.
They don't always agree. CNN was at 14 (extreme fear) today. Ours read 47 (neutral). The gap is structural — CNN uses raw market fear indicators (put/call volume ratios, safe haven demand). Ours uses signal derivatives...processed data designed to find trading opportunities, not just measure fear. Both are valid reads. Having both on one screen is the point.
Paper Trading Today, Live Tomorrow
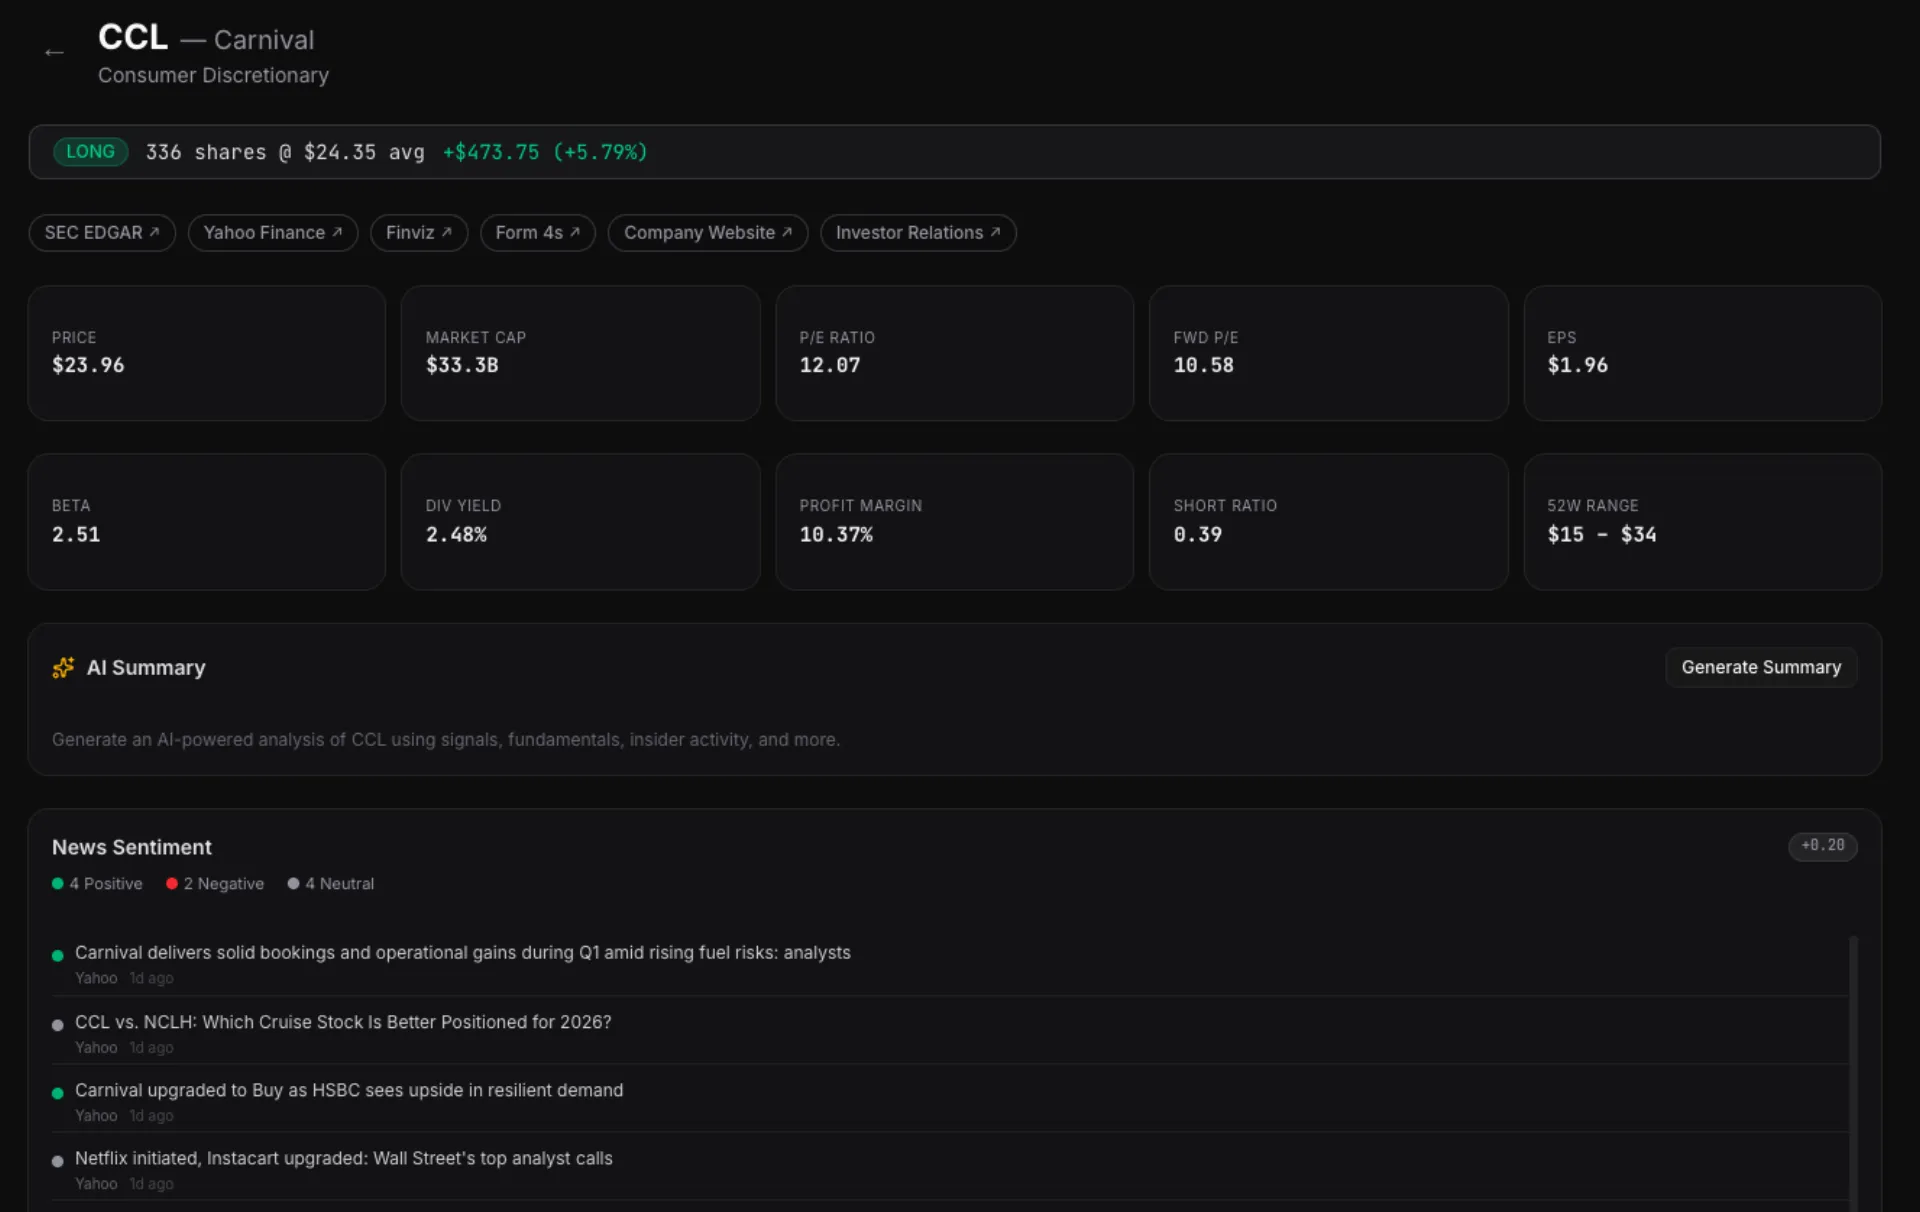
The platform trades on paper through Alpaca's API. Real orders, real fills, simulated money. Ten positions open right now...FCX, CCL, TER, SNDK, and six others...all entered by the system based on signal conviction.
The architecture is broker-agnostic. Alpaca is the first integration, but the trading loop is designed to plug into any brokerage API — Schwab, E-Trade, Interactive Brokers. The signals, sizing, and risk management don't change. Only the order submission layer swaps out.
Going live is a configuration change, not a rewrite.
The Autonomous Research Pipeline
The part that still surprises me: the platform discovers its own trading strategies.
The research pipeline was inspired by Andrej Karpathy's auto-research repo — the idea that AI agents can autonomously discover, evaluate, and validate hypotheses. I adapted the concept for quantitative finance, but the architecture is deliberately domain-agnostic. The same five-agent loop could research access switching growth tactics, real estate leasing trends, or any domain where hypotheses can be tested against data.
Five AI agents run on a schedule. A Prospector scrapes arXiv papers, podcast transcripts, and quant blogs for new ideas. An Analyst evaluates whether they're testable. An Architect designs backtest experiments. An Experimenter runs them autonomously overnight. A Reviewer evaluates the results against hard acceptance criteria and either rejects, flags for human review, or promotes to the next stage.
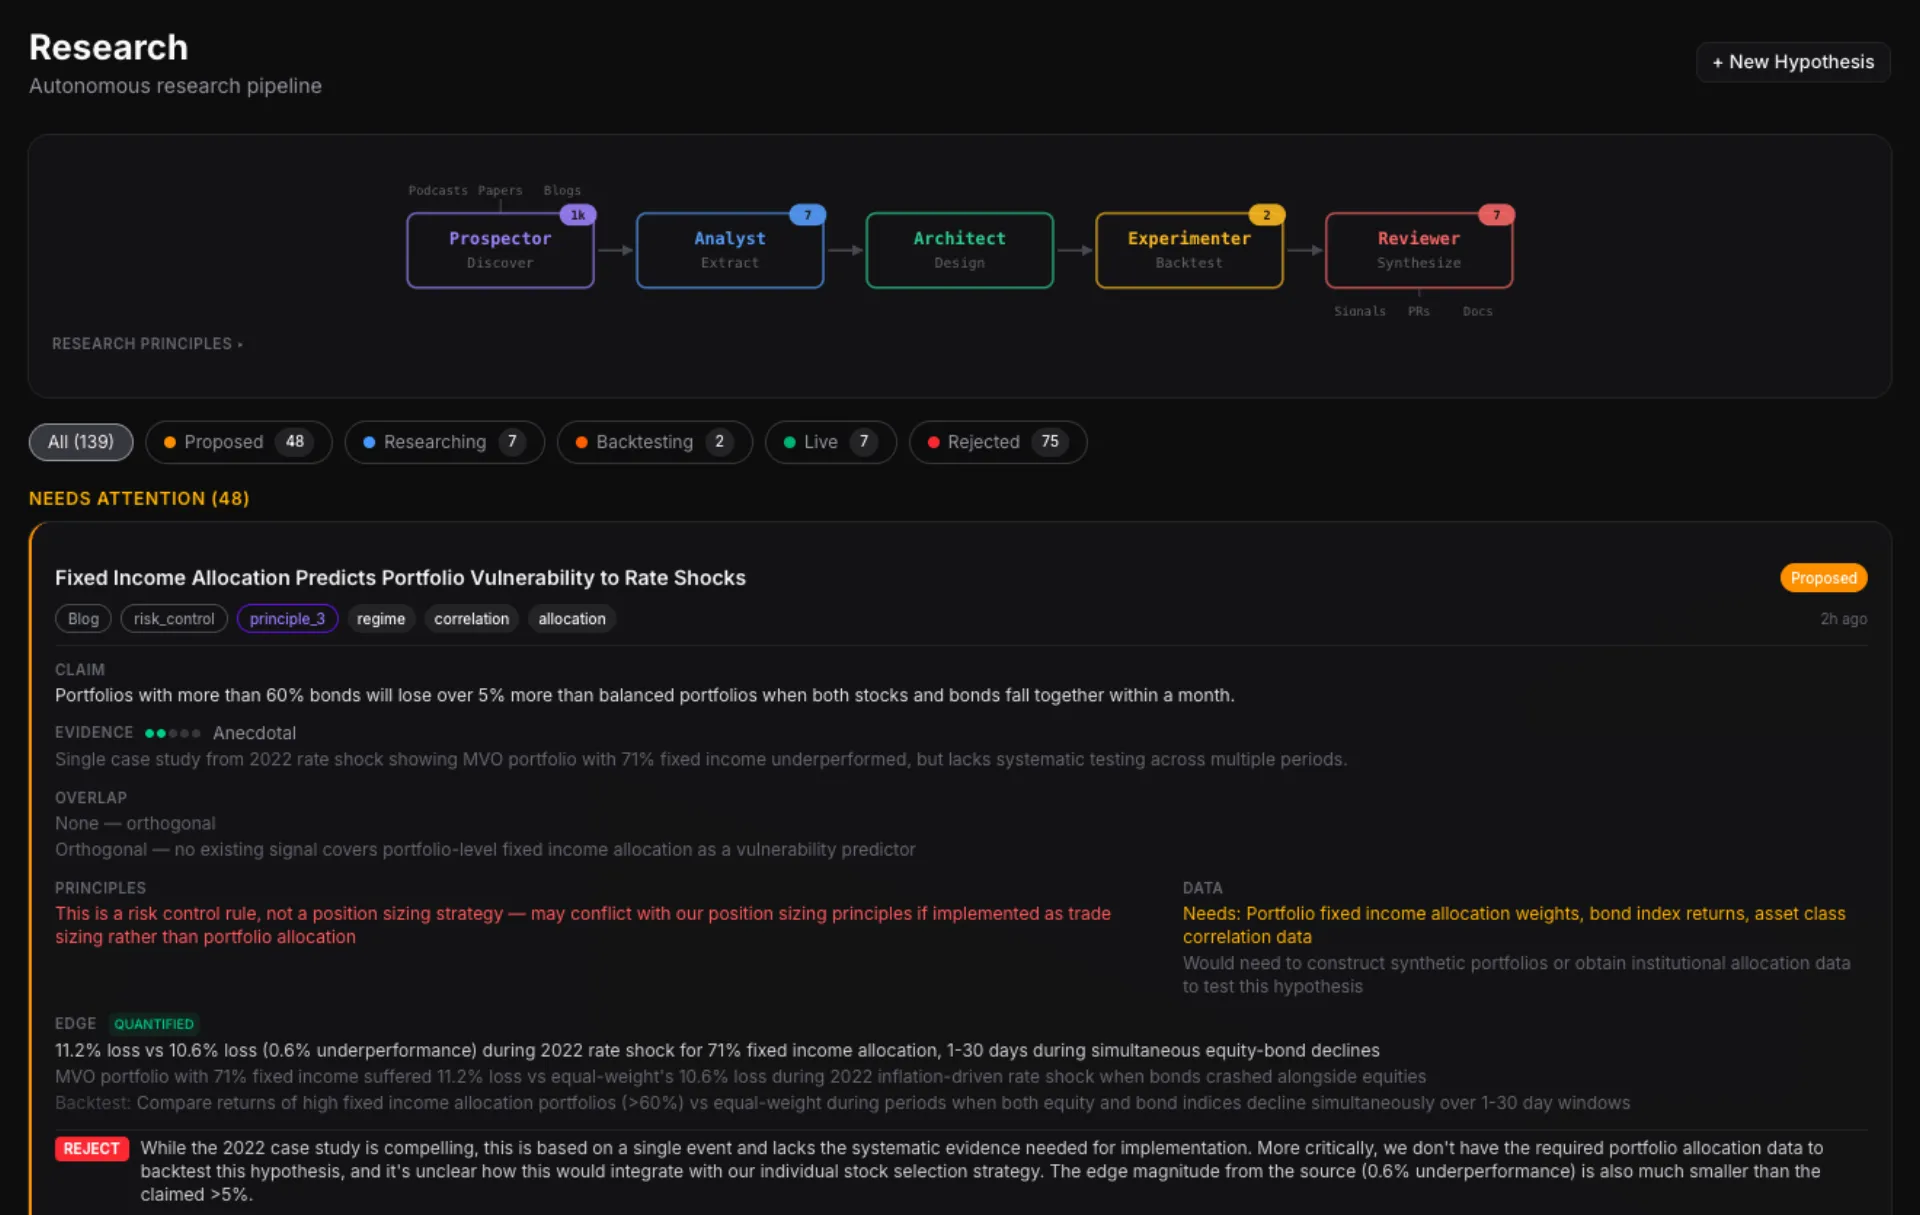
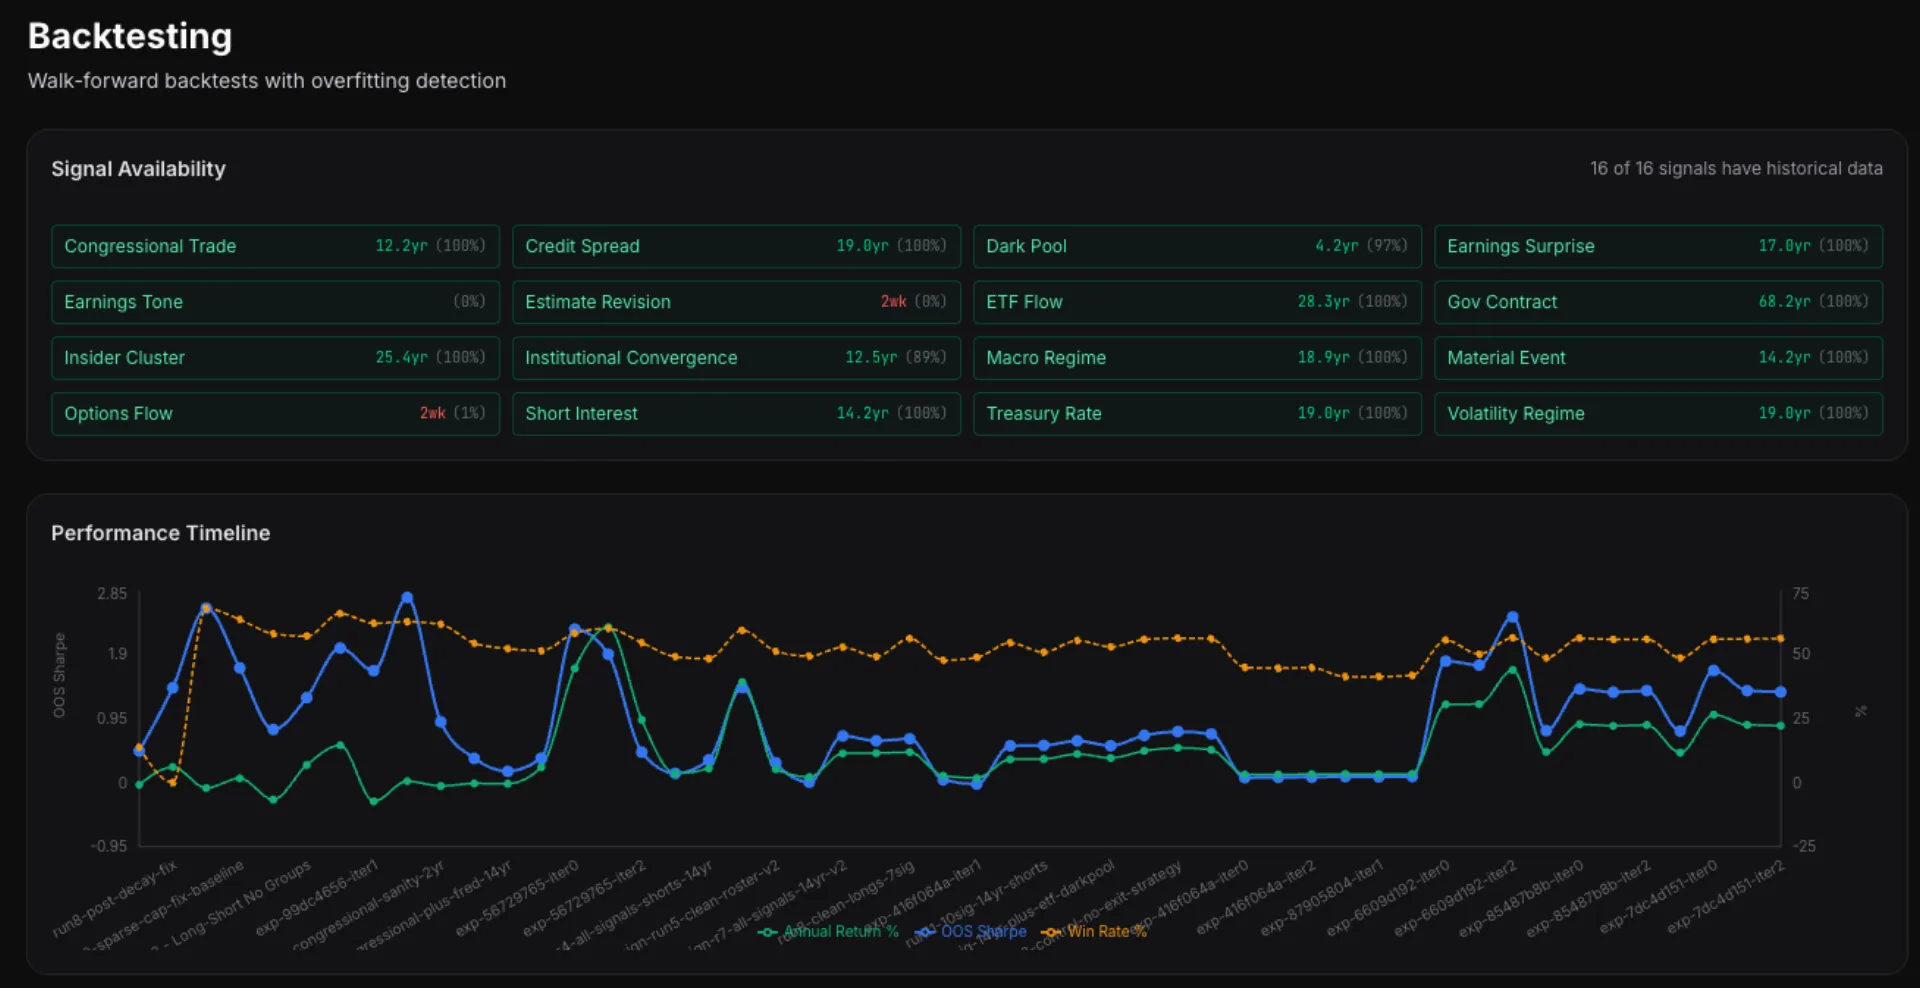
139 hypotheses tracked so far. 75 auto-rejected. 7 in live production. The pipeline found and validated strategies I wouldn't have discovered manually...and killed dozens that looked promising on paper but failed the walk-forward backtest.
The Real Point
This isn't about quant trading specifically. It's about what happens when the cost of building custom, domain-specific software approaches zero.
A year ago, building a platform like this required a team of quant developers, a data engineering pipeline, and a seven-figure infrastructure budget. Today it requires clarity about what you want to build, access to public data, and an AI coding agent that can translate intent into working software.
I replaced six SaaS subscriptions with custom tools over a weekend. Then I built a smart building strategy platform. Then a career coaching platform. Now a quantitative trading system that ingests the same data Goldman Sachs uses.
The pattern is always the same. The tools are available. The data is public. The only bottleneck is knowing what to build.